
Product
Features
The End of Great Work
with Bad Tools

New
Real-time data
Beyond standard analytics
We make data accessible and actionable for teams of all sizes.
Offline data processing
Turn raw data into useful insights right away. Edgehouse's local processing engine analyzes data points in seconds, giving you current information when you need to make quick decisions.
Smart predictive analytics
See what's coming before it happens. Our machine learning spots patterns and shows future trends, helping your team get ahead of changes and stay in front of competitors.
Edgehouse Gaming is split into three versions:
CORE
COMMAND
HELM

CORE: is a great way to get started with Edgehouse Gaming. All the standard reporting and tracking you need.
Data Analysis Dashboard
KAM Hub
Game Analysis
Commercial Dashboard
Data Analysis Dashboard
Your command center. Updated, ready, and built for your morning routine.
The Data Analysis Dashboard gives you a real-time snapshot of everything that matters across your portfolio. No more logging into multiple systems or pulling numbers from scattered sources, your month-to-date performance, trends, and top performers are all waiting in one place the moment you open the app.

Month-to-Date Performance
See exactly where you stand right now. GGR, total bets, RTP, active games, unique players, and revenue quality indicators like GGR margin and bonus cost ratio, all updated with percentage change indicators so you know whether you're up, down, or holding steady.
Performance Trends
Spot patterns over time with a flexible time-series chart. Toggle between daily, weekly, monthly, quarterly, or yearly intervals to identify which operators are growing, which are declining, and where your attention is needed most.
Top Operators & Markets
Know your best performers at a glance. See which operators and markets are driving your numbers so you can prioritize your time where it has the most impact.
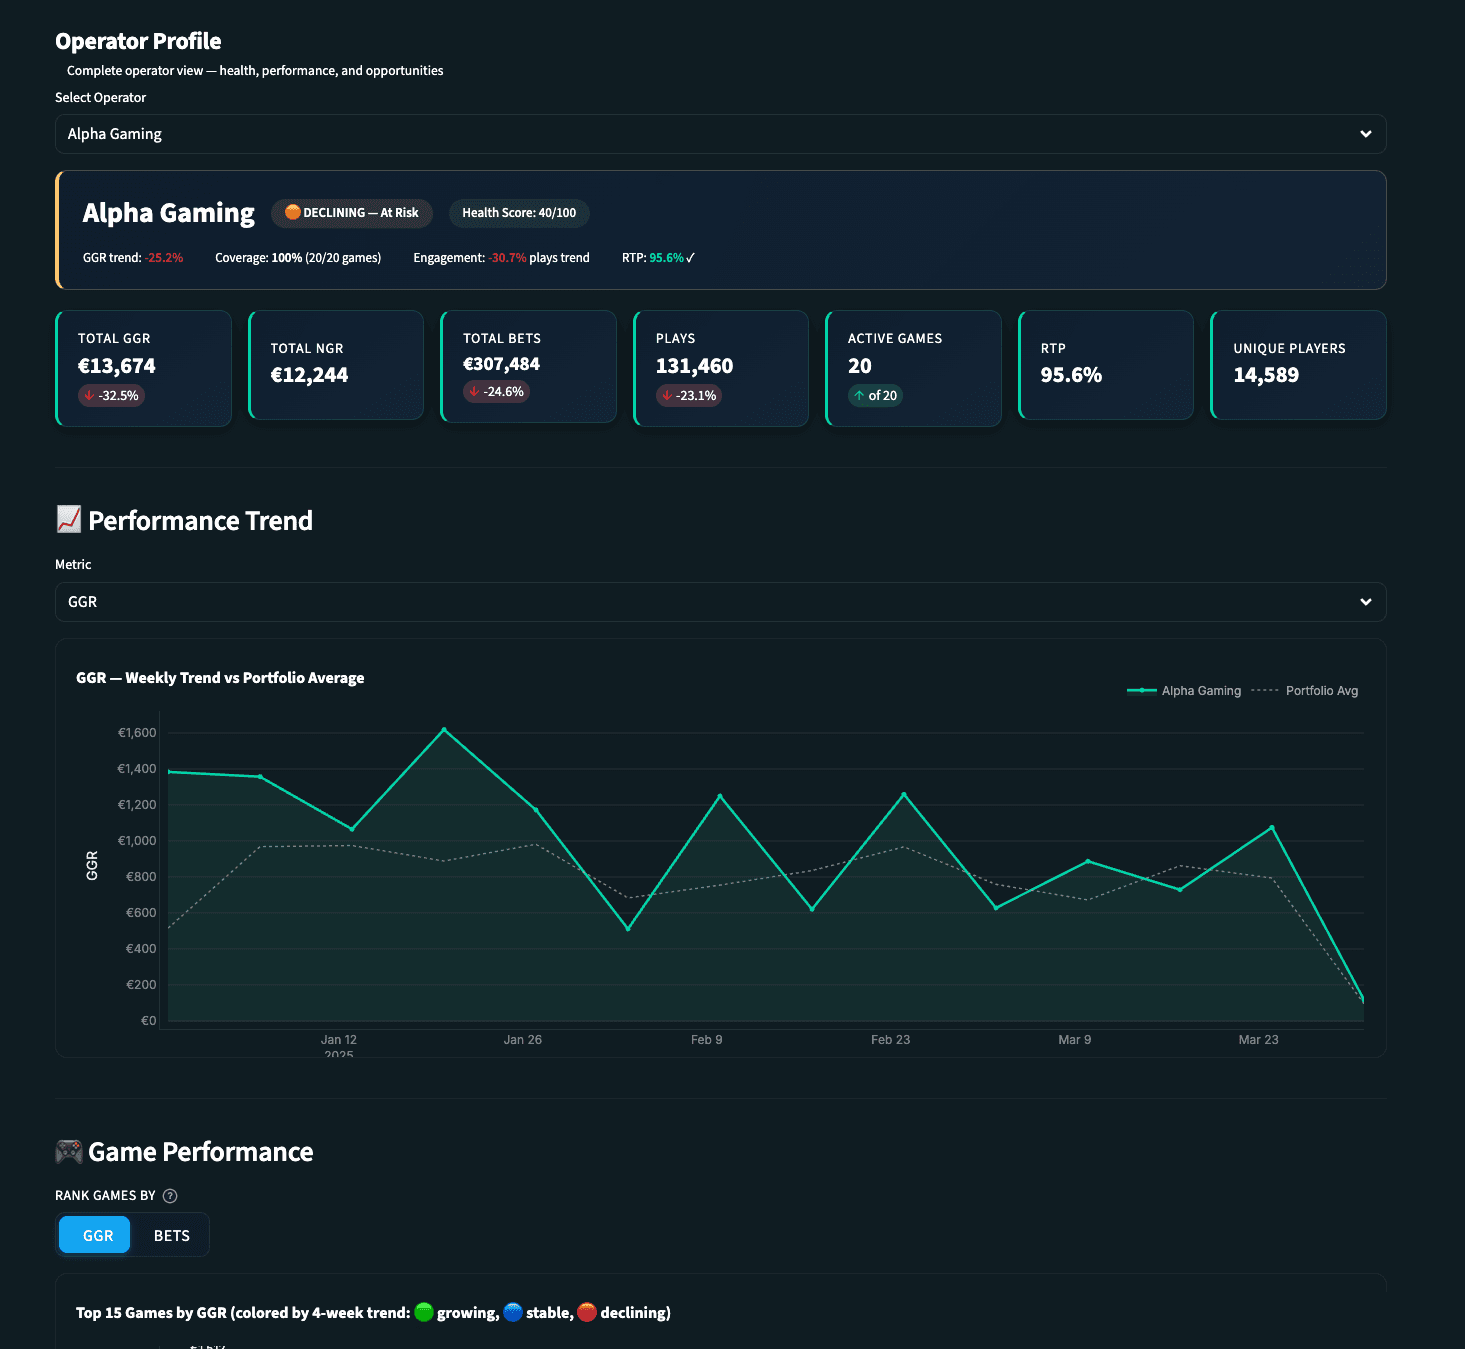
Operator Profiles
A complete 360-degree view of each operator's health. Revenue, game mix, activity trends, health score indicators, game coverage percentage, and unique players, all in one place. Weekly GGR trend lines compared against the portfolio average show you instantly whether an operator is outperforming or underperforming.
Performance Goal Tracking
Set financial targets per operator and track your progress throughout the quarter. See at a glance whether you're on track, ahead, or need to adjust your approach. Goal tracking visualizations with progress gauges and target lines on charts.
Game Performance Comparison
Search and select multiple games to compare side by side on a single chart. Track by bets, GGR, plays, or unique players across any date range. A sortable summary table with full metrics is exportable to Excel.
Jackpot Report
Track jackpot game performance and understand the impact of jackpot mechanics on operator engagement. Tag and manage your jackpot titles for accurate, focused reporting.
Game Launch Performance
Measure how new game launches are performing across your operators. Know within days whether a launch is gaining traction or needs attention. Powered by your uploaded launch date data.
Game Lifecycle
See the full arc of a game's performance from launch through maturity. Make informed decisions about when to promote, reposition, or retire titles based on real trajectory data.
Market Share Analysis
Revenue distribution by country, operator group, or individual operator. Donut charts and configurable top-N views show you where you stand relative to the market and where the biggest opportunities lie.
Game Opportunities
The Game Opportunities feature analyzes your operators' game catalogs and highlights the gaps, games that are performing well elsewhere but aren't yet live with a specific operator. This turns data into action: walk into your next operator meeting with a tailored recommendation backed by real performance data, not a hunch.
Data Comparisons
Compare performance across operators, markets, time periods, or game categories. Find the patterns that drive better strategy and spot anomalies that need investigation.
Data Ingestion
Upload your data easily. Edgehouse Gaming processes CSV and Excel files up to 200MB and puts them to work across every dashboard and report. Upload multiple files and they're automatically combined. Intelligent column detection maps your fields automatically, review and adjust as needed.
Operator Goal Setting
Define financial performance targets per operator. These goals feed into the KAM Hub and goal tracking features, giving you live progress tracking throughout the quarter.
Custom Operator Groups
Combine multiple operators into logical business groups for aggregated analysis. Group by tier, region, strategic priority, or any structure that matches how you think about your portfolio.
Sidebar Filters
A persistent sidebar lets you narrow your view by date range, operator group, individual operator, game owner, country, mode, or channel. Filters apply across every page in the dashboard, set them once and explore your entire portfolio through the lens that matters right now.
Graph & Chart Download
All graphs and charts found in Edgehouse Gaming are available for download as PNGs for use in your own presentations. Added features include scrolling, zooming and drill down on many graphs and charts.
Help Center
A built-in help section with practical, jargon-free guidance on how to use every feature. No technical documentation, no developer speak, just straightforward instructions to help you get the most from Edgehouse Gaming. If you can use a spreadsheet, you can use Edgehouse Gaming.
Edgehouse Gaming is split into three versions:
CORE
COMMAND
HELM
CORE: is a great way to get started with Edgehouse Gaming. All the standard reporting and tracking you need.
Analysis Dashboard
KAM Hub
Game Analysis
Commercial Dashboard
Data Analysis Dashboard
Your command center. Updated, ready, and built for your morning routine.
The Data Analysis Dashboard gives you a real-time snapshot of everything that matters across your portfolio. No more logging into multiple systems or pulling numbers from scattered sources, your month-to-date performance, trends, and top performers are all waiting in one place the moment you open the app.
Month-to-Date Performance
See exactly where you stand right now. GGR, total bets, RTP, active games, unique players, and revenue quality indicators like GGR margin and bonus cost ratio, all updated with percentage change indicators so you know whether you're up, down, or holding steady.
Performance Trends
Spot patterns over time with a flexible time-series chart. Toggle between daily, weekly, monthly, quarterly, or yearly intervals to identify which operators are growing, which are declining, and where your attention is needed most.
Top Operators & Markets
Know your best performers at a glance. See which operators and markets are driving your numbers so you can prioritize your time where it has the most impact.
Operator Profiles
A complete 360-degree view of each operator's health. Revenue, game mix, activity trends, health score indicators, game coverage percentage, and unique players, all in one place. Weekly GGR trend lines compared against the portfolio average show you instantly whether an operator is outperforming or underperforming.
Performance Goal Tracking
Set financial targets per operator and track your progress throughout the quarter. See at a glance whether you're on track, ahead, or need to adjust your approach. Goal tracking visualizations with progress gauges and target lines on charts.
Game Performance Comparison
Search and select multiple games to compare side by side on a single chart. Track by bets, GGR, plays, or unique players across any date range. A sortable summary table with full metrics is exportable to Excel.
Jackpot Report
Track jackpot game performance and understand the impact of jackpot mechanics on operator engagement. Tag and manage your jackpot titles for accurate, focused reporting.
Game Launch Performance
Measure how new game launches are performing across your operators. Know within days whether a launch is gaining traction or needs attention. Powered by your uploaded launch date data.
Game Lifecycle
See the full arc of a game's performance from launch through maturity. Make informed decisions about when to promote, reposition, or retire titles based on real trajectory data.
Market Share Analysis
Revenue distribution by country, operator group, or individual operator. Donut charts and configurable top-N views show you where you stand relative to the market and where the biggest opportunities lie.
Game Opportunities
The Game Opportunities feature analyzes your operators' game catalogs and highlights the gaps, games that are performing well elsewhere but aren't yet live with a specific operator. This turns data into action: walk into your next operator meeting with a tailored recommendation backed by real performance data, not a hunch.
Data Comparisons
Compare performance across operators, markets, time periods, or game categories. Find the patterns that drive better strategy and spot anomalies that need investigation.
Data Ingestion
Upload your data easily. Edgehouse Gaming processes CSV and Excel files up to 200MB and puts them to work across every dashboard and report. Upload multiple files and they're automatically combined. Intelligent column detection maps your fields automatically, review and adjust as needed.
Operator Goal Setting
Define financial performance targets per operator. These goals feed into the KAM Hub and goal tracking features, giving you live progress tracking throughout the quarter.
Custom Operator Groups
Combine multiple operators into logical business groups for aggregated analysis. Group by tier, region, strategic priority, or any structure that matches how you think about your portfolio.
Sidebar Filters
A persistent sidebar lets you narrow your view by date range, operator group, individual operator, game owner, country, mode, or channel. Filters apply across every page in the dashboard, set them once and explore your entire portfolio through the lens that matters right now.
Graph & Chart Download
All graphs and charts found in Edgehouse Gaming are available for download as PNGs for use in your own presentations. Added features include scrolling, zooming and drill down on many graphs and charts.
Help Center
A built-in help section with practical, jargon-free guidance on how to use every feature. No technical documentation, no developer speak, just straightforward instructions to help you get the most from Edgehouse Gaming. If you can use a spreadsheet, you can use Edgehouse Gaming.
Edgehouse Gaming is split into three versions:
CORE
COMMAND
HELM
CORE: is a great way to get started with Edgehouse Gaming. All the standard reporting and tracking you need.
Data Analysis Dashboard
KAM Hub
Game Analysis
Commercial Dashboard
Data Analysis Dashboard
Your command center. Updated, ready, and built for your morning routine.
The Data Analysis Dashboard gives you a real-time snapshot of everything that matters across your portfolio. No more logging into multiple systems or pulling numbers from scattered sources, your month-to-date performance, trends, and top performers are all waiting in one place the moment you open the app.
Month-to-Date Performance
See exactly where you stand right now. GGR, total bets, RTP, active games, unique players, and revenue quality indicators like GGR margin and bonus cost ratio, all updated with percentage change indicators so you know whether you're up, down, or holding steady.
Performance Trends
Spot patterns over time with a flexible time-series chart. Toggle between daily, weekly, monthly, quarterly, or yearly intervals to identify which operators are growing, which are declining, and where your attention is needed most.
Top Operators & Markets
Know your best performers at a glance. See which operators and markets are driving your numbers so you can prioritize your time where it has the most impact.
Operator Profiles
A complete 360-degree view of each operator's health. Revenue, game mix, activity trends, health score indicators, game coverage percentage, and unique players, all in one place. Weekly GGR trend lines compared against the portfolio average show you instantly whether an operator is outperforming or underperforming.
Performance Goal Tracking
Set financial targets per operator and track your progress throughout the quarter. See at a glance whether you're on track, ahead, or need to adjust your approach. Goal tracking visualizations with progress gauges and target lines on charts.
Game Performance Comparison
Search and select multiple games to compare side by side on a single chart. Track by bets, GGR, plays, or unique players across any date range. A sortable summary table with full metrics is exportable to Excel.
Jackpot Report
Track jackpot game performance and understand the impact of jackpot mechanics on operator engagement. Tag and manage your jackpot titles for accurate, focused reporting.
Game Launch Performance
Measure how new game launches are performing across your operators. Know within days whether a launch is gaining traction or needs attention. Powered by your uploaded launch date data.
Game Lifecycle
See the full arc of a game's performance from launch through maturity. Make informed decisions about when to promote, reposition, or retire titles based on real trajectory data.
Market Share Analysis
Revenue distribution by country, operator group, or individual operator. Donut charts and configurable top-N views show you where you stand relative to the market and where the biggest opportunities lie.
Game Opportunities
The Game Opportunities feature analyzes your operators' game catalogs and highlights the gaps, games that are performing well elsewhere but aren't yet live with a specific operator. This turns data into action: walk into your next operator meeting with a tailored recommendation backed by real performance data, not a hunch.
Data Comparisons
Compare performance across operators, markets, time periods, or game categories. Find the patterns that drive better strategy and spot anomalies that need investigation.
Data Ingestion
Upload your data easily. Edgehouse Gaming processes CSV and Excel files up to 200MB and puts them to work across every dashboard and report. Upload multiple files and they're automatically combined. Intelligent column detection maps your fields automatically, review and adjust as needed.
Operator Goal Setting
Define financial performance targets per operator. These goals feed into the KAM Hub and goal tracking features, giving you live progress tracking throughout the quarter.
Custom Operator Groups
Combine multiple operators into logical business groups for aggregated analysis. Group by tier, region, strategic priority, or any structure that matches how you think about your portfolio.
Sidebar Filters
A persistent sidebar lets you narrow your view by date range, operator group, individual operator, game owner, country, mode, or channel. Filters apply across every page in the dashboard, set them once and explore your entire portfolio through the lens that matters right now.
Graph & Chart Download
All graphs and charts found in Edgehouse Gaming are available for download as PNGs for use in your own presentations. Added features include scrolling, zooming and drill down on many graphs and charts.
Help Center
A built-in help section with practical, jargon-free guidance on how to use every feature. No technical documentation, no developer speak, just straightforward instructions to help you get the most from Edgehouse Gaming. If you can use a spreadsheet, you can use Edgehouse Gaming.
Start now
Ready to make better decisions with your data?
Try Edgehouse Gaming for free.
Start now
Ready to make better decisions with your data?
Try Edgehouse Gaming for free.
Start now
Ready to make better decisions with your data?
Try Edgehouse Gaming for free.