
Using the Home Dashboard
The Home page is your morning starting point. It gives you an at-a-glance view of your entire portfolio’s month-to-date performance, trends, and key indicators. Everything on this page updates automatically based on your sidebar filter selections, so you can view your full portfolio or drill into a specific operator, market, or channel in seconds.
Month-to-Date Performance
The top section of the Home page displays a row of KPI cards showing your portfolio’s core metrics for the current month-to-date period. Each card includes the current value and a percentage change indicator compared to the previous period, so you can instantly see whether each metric is trending up or down.
Bets - Total bet volume across your portfolio for the month-to-date period. This is your primary engagement metric, showing the total amount wagered by players.
GGR - Gross Gaming Revenue for the period. This is revenue before any deductions and is typically the most watched number on the dashboard.
RTP - The aggregate Return to Player percentage across your portfolio. A higher RTP means more is being returned to players; significant shifts may warrant investigation.
Plays - Total number of individual game rounds played. This indicates overall player activity levels across your portfolio.
Bonus - Total bonus amounts for the period, if bonus data is included in your uploads.
NGR - Net Gaming Revenue, calculated after revshare deductions. Only available if revshare rates have been configured in Settings.
Below the primary KPI row, additional cards display jackpot-specific metrics (if jackpot games are configured): JP Contribution, JP Awarded, JP Net Reserve, JP Win Ratio, Contribution Rate, Unique Players, GGR per Player, Bets per Player, and JP Payout Ratio.
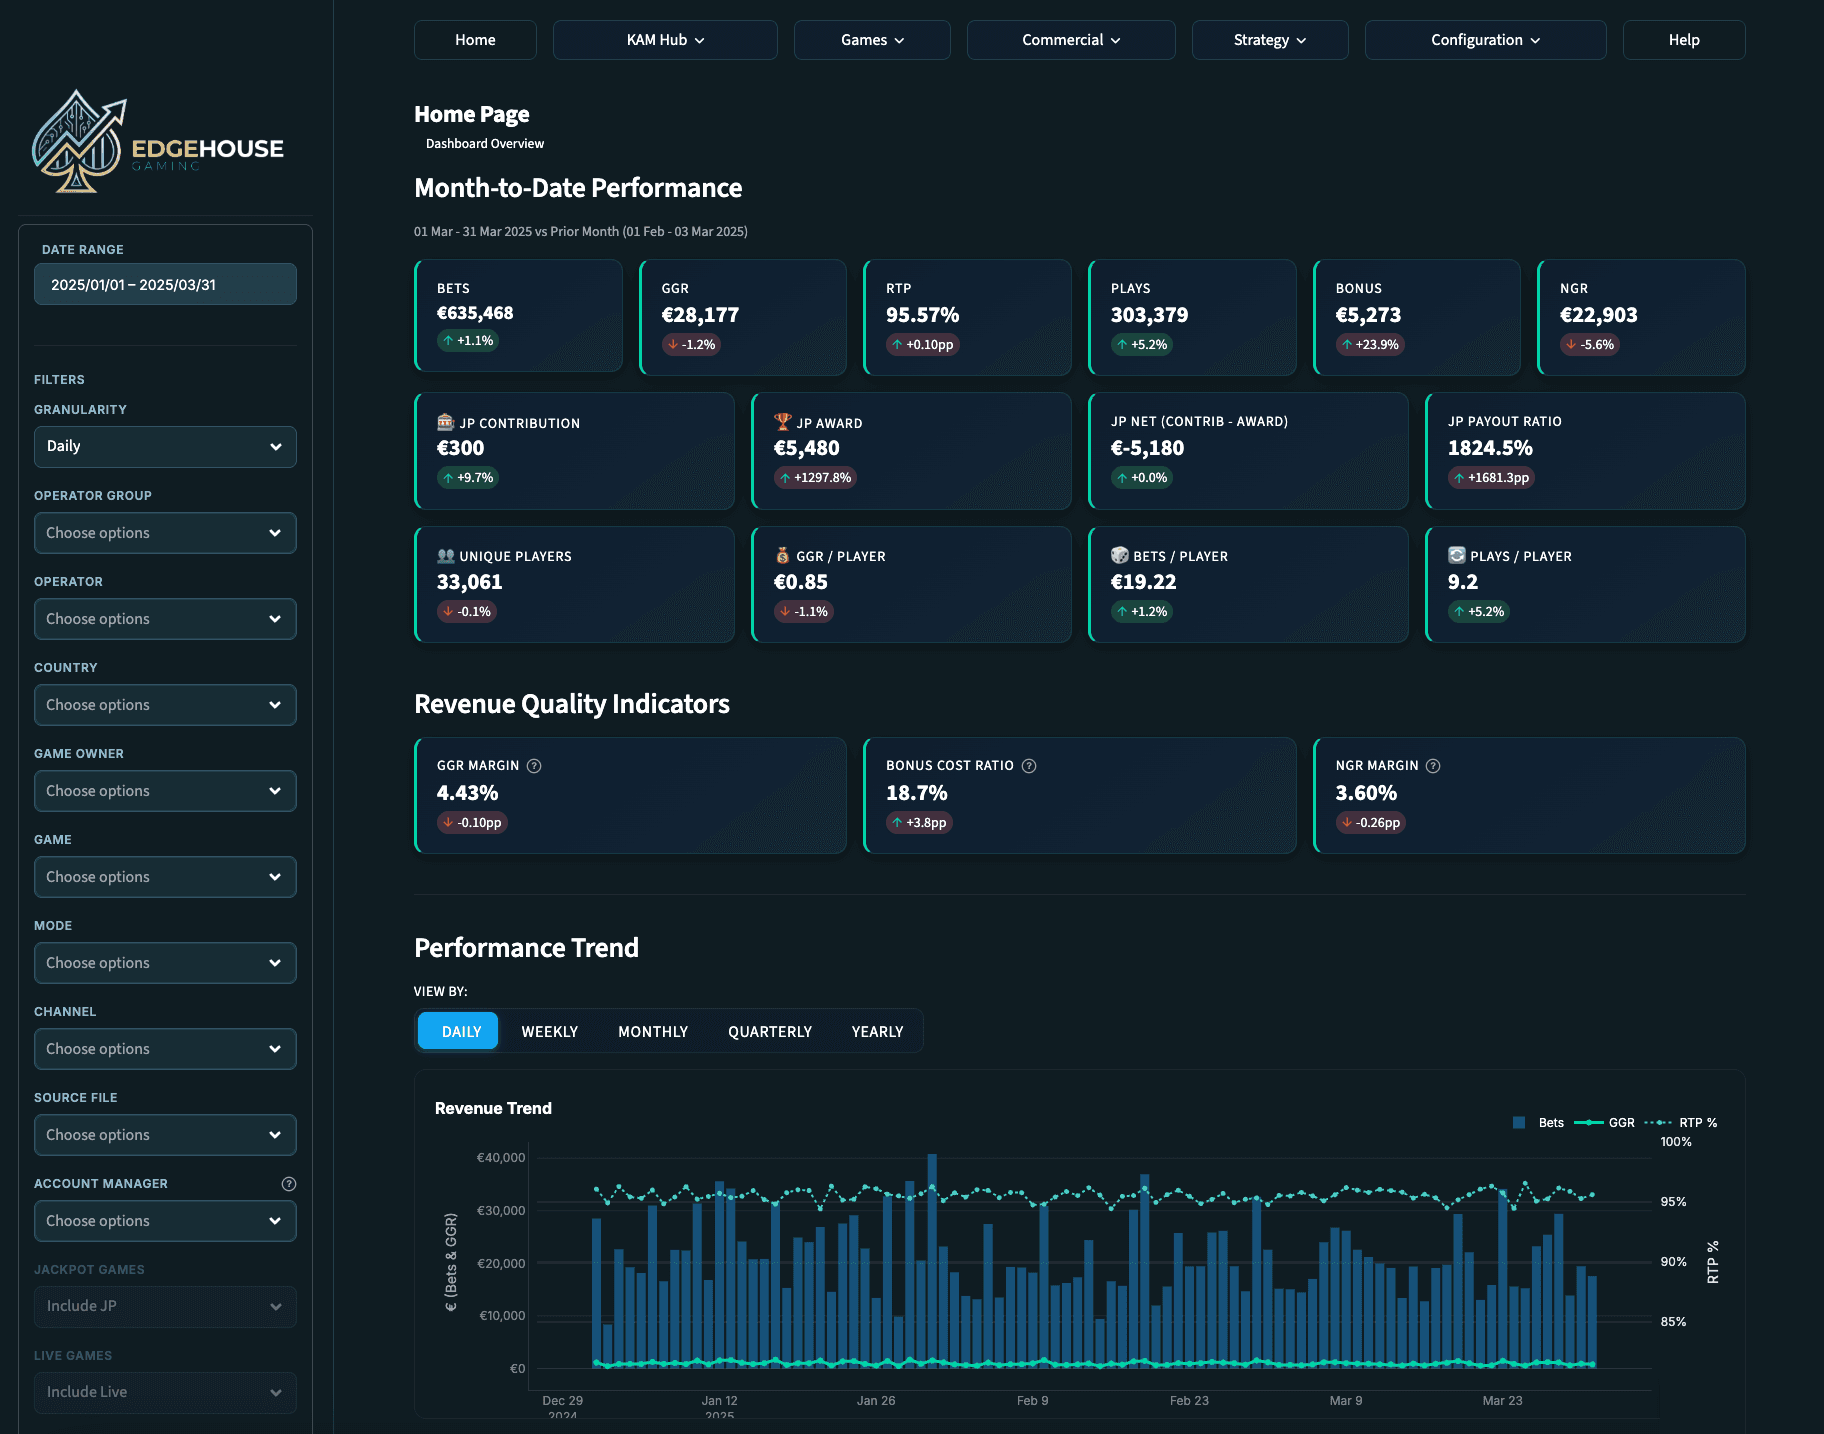
Revenue Quality Indicators
Below the performance cards, three dedicated cards help you understand the quality of your revenue, not just the volume.
GGR Margin - The percentage of total bets retained as revenue. A higher margin means you are retaining more per bet. This metric is influenced by game mix, RTP settings, and player behaviour.
Bonus Cost Ratio - The percentage of GGR consumed by bonus costs. A rising bonus cost ratio may indicate that promotional spend is eating into your margins.
NGR Margin - Net revenue as a percentage of bets, after revshare deductions. This gives you the truest picture of commercial efficiency.
▶ TIP: Monitor the Revenue Quality Indicators alongside your GGR trend. Growing GGR with declining margins may not be sustainable, and steady GGR with improving margins is often more valuable than raw volume growth.
Performance Trend
The Performance Trend section displays a time-series chart that visualises your revenue trend over your selected date range. You can toggle the time granularity using the buttons above the chart: Daily, Weekly, Monthly, Quarterly, or Yearly. The chart can display multiple metrics simultaneously, letting you overlay Bets, GGR, RTP%, and other metrics to spot correlations and divergences.
Use this chart to answer questions like: Is my portfolio growing month over month? Are there seasonal patterns in my revenue? When did a decline start, and does it coincide with any known events?
Game Performance
The Game Performance section provides a ranked view of individual game metrics across your portfolio. This table shows your top games by GGR or Bets, with additional columns for plays, RTP, unique players, and trend indicators. Use this to quickly identify which titles are driving your portfolio’s performance and which may need attention.
Each game row includes a 4-week trend indicator (growing, stable, or declining) so you can spot momentum shifts without navigating to the detailed Game Analysis page.
Top Operators & Markets
Two ranked views show your strongest performers at a glance.
Top Operators - A ranked list of operators sorted by total bets or GGR for the selected period. See which operators are driving the most activity and revenue in your portfolio.
Top Markets - A ranked list of countries sorted by the same metrics. Understand your geographic revenue distribution and which markets are contributing most to your bottom line.
Quick Alerts
The Quick Alerts section surfaces potential issues that may need your attention. These are automatically generated based on anomaly detection in your data, for example, operators with sudden declines, games with unusual RTP shifts, or markets with significant performance changes. Think of these as early warning flags that help you catch problems before they grow.
Channel & Product Mix
Pie charts at the bottom of the Home page show the split between desktop and mobile play, as well as revenue by product category (if multiple game types exist in your data). You can toggle these views between Bets and GGR to understand whether your channel distribution is consistent across volume and revenue.
Understanding your channel mix is important for operator conversations, if mobile is growing rapidly, you can prioritise mobile-optimised games. If desktop still dominates for certain operators, you know where to focus.
Common Use Cases
Morning check-in - Open the Home Dashboard first thing to scan your month-to-date KPIs, check for any Quick Alerts, and review the Performance Trend. This takes less than a minute and gives you confidence about your portfolio’s current state.
Preparing for a team meeting - Use the Top Operators and Top Markets sections as talking points. Combine with the Revenue Quality Indicators to add depth beyond just volume numbers.
Investigating a concern - If a KPI card shows a significant negative change, use the Performance Trend chart to identify when the decline started, then apply sidebar filters to narrow down which operator, market, or game is responsible.
Monthly reporting - Screenshot or export the key sections of the Home Dashboard for inclusion in monthly reports to leadership.